One thing that is a key asset in any environment is reliable, thorough monitoring. Once as you add more redundant layers to your infrastructure, automated monitoring is frequently the only way to tell if something has failed, short of manual checking.
When setting up monitoring for my OPNSense routers, though, I wasn’t super thrilled with the default options. There’s an SNMP template available in Zabbix, but SNMP set up on OPNSense didn’t seem straightforward, and I especially didn’t want to risk exposing this data to untrusted networks my router may sit on.
There is a Zabbix Agent plugin available, which configures a Zabbix specific monitoring agent, but then no useful template exists. I ended up going this route and setting up some scripts to help out.
What I Didn’t Like
If you choose to use the Zabbix Agent to monitor your router, there is no template available by default. This isn’t a huge deal, since OPNSense is based on FreeBSD, and there’s a pretty good FreeBSD template. This lacks two key data points though:
- Interface names are hardware device names. - For example, your LAN
connection isn’t called LAN or the description you put in, it’s called
something like
vtnet1. On a router with more than a few interfaces, this makes most of the metrics had to tie to interfaces in OPNSense. - No OPNSense specific things - The FreeBSD template excludes all of the OPNSense specific data points you may wish to monitor. The two that I really needed to keep track of for my environment are CARP status of interfaces and Gateway status.
LLD in Zabbix
One key thing we’ll use to fix these issues is Low Level Discovery or LLD in Zabbix. At first, it seems odd, but once you understand the theory of how this system works, it becomes incredibly powerful. You don’t need to understand the theory, but it’s worth pointing out.
The issue here is things like interfaces are multiple of the same type of thing. We want to monitor the same data points on each interface, but we don’t want to add the same rule 15 times. LLD lets us define a key that lists the interfaces, then create a template for items to monitor that are applied to all the items found.
There’s a number of different ways to accomplish LLD, but I use a two step process. First, we make a Zabbix key that will get the JSON list of things we want to keep track of. Second, we call a script to get the specific data point we’re interested in.
As an example, I use LLD for gateways. The first key, opn.gateways returns
this JSON data:
[
    {
        "name": "GW_1",
    },
    {
        "name": "GW_2"
    }
]
We can use this as an LLD rule and map the name key to a macro for use in
Zabbix. The second key is opn.gateway_value, and when we give a gateway name
and field name, it returns the value.
For all this to work, we need a number of things set up:
- A script to get the data and values. I use one script for both.
- User parameters in Zabbix that lets you call this script and get it’s data.
This is the glue that maps a Zabbix key (
opn.gateways) to our script itself. - A template with LLD rules in Zabbix to make use of all this data.
The Data Scripts
The first thing we need is a few scripts to get OPNSense specific data and return it to Zabbix. These will be called by the Zabbix agent process on a fixed interval and have two roles: Return a list of resources for a given item (say a list of gateways), and also return data for each of the gateways.
I’ve put all these scipts and files on GitHub
Interfaces
The first script is to get interface data. FreeBSD’s template gets hardware names, but as mentioned having the names we enter is OPNSense makes data correlation much easier.
Here’s the script I wrote:
import json
import subprocess
import re
import sys

import xml.etree.ElementTree as ET
import sys

root = ET.parse('/conf/config.xml').getroot()

process=subprocess.Popen(['ifconfig'], stdout=subprocess.PIPE)

if len(sys.argv) == 3:
    want_name = sys.argv[1]
    want_value = sys.argv[2]
else:
    want_name = False
    want_value = False

interfaces = []
interface = None
for line in process.stdout:
    line = line.decode('utf-8')
    if not line.startswith('\t'):
        name = line.split(':')[0]

        if want_name and want_name != name:
            continue

        if interface is not None:
            interfaces.append(interface)

        interface = {
            'name': name
        }

        for conf_interface in root.findall('interfaces')[0]:
            if conf_interface.findall('if')[0].text == name:
                interface['description'] = conf_interface.findall('descr')[0].text
    else:
        if interface is None:
            continue

        line = line.replace('\t','')
        line = line.replace('\n','')
        data = line.split(':')
        if len(data) < 2:
            continue

        field_name = data[0]
        if want_value and field_name != want_value:
            continue

        # Sometimes this is data that broken up.  We don't have to use this though
        fields = data[1].split(' ')
        if field_name == 'carp':
            if fields[1] == 'MASTER':
                interface['carp'] = 0
            else:
                interface['carp'] = 1
        elif field_name == 'status':
            interface['status'] = data[1]


interfaces.append(interface)

if not want_name:
    print(json.dumps(interfaces, indent=2))
else:
    print(interfaces[0][want_value])
Create that file at /usr/home/interface.py on your OPNSense server. You can
use SSH to do this.
Gateways
The other key data point I want to keep track of is the status of gateways and key metrics like packet loss.
Here’s the script for gateways:
import json
import subprocess
import sys

process=subprocess.Popen(['pluginctl','-r','return_gateways_status'], stdout=subprocess.PIPE, stderr=subprocess.PIPE)
out, err = process.communicate()
data = json.loads(out)

if len(sys.argv) == 3:
    want_name = sys.argv[1]
    want_value = sys.argv[2]
else:
    want_name = False
    want_value = False

data_out = []
for gw in data['dpinger']:
    data_out.append({
        "{#GW_NAME}": data['dpinger'][gw]['name']
    })

if not want_name:
    print(json.dumps(data_out, indent=2))
    sys.exit(0)


# Normalize some values
if sys.argv[2] == 'status':
    if data['dpinger'][sys.argv[1]][sys.argv[2]] == 'none':
        value = 0
    elif data['dpinger'][sys.argv[1]][sys.argv[2]] == 'down':
        value = 2
    else:
        value = 1
elif sys.argv[2] == 'delay' or sys.argv[2] == 'stddev':
    value = data['dpinger'][sys.argv[1]][sys.argv[2]].replace(" ms","")
elif sys.argv[2] == 'loss':
    value = data['dpinger'][sys.argv[1]][sys.argv[2]].replace(" %","")
else:
    value = data['dpinger'][sys.argv[1]][sys.argv[2]]


print(value)
Like before, add that to /usr/home/gws.py.
Zabbix User Scripts
Now we need to inform Zabbix about how these scripts can be used. Once you’ve installed the Zabbix plugin in OPNSense and added any needed firewall rules, you should have a “Zabbix Agent” section now under Services.
On the overview page, make sure “Enable sudo root permissions” is checked. The configuration file for Opnsense is owned by root, so our script will have to use sudo to be able to access the config files.
Navigate to the settings page, and the “Advanced” tab. We’ll create 4 user parameters. There’s only a few options on each, and they’ll generally look the same.
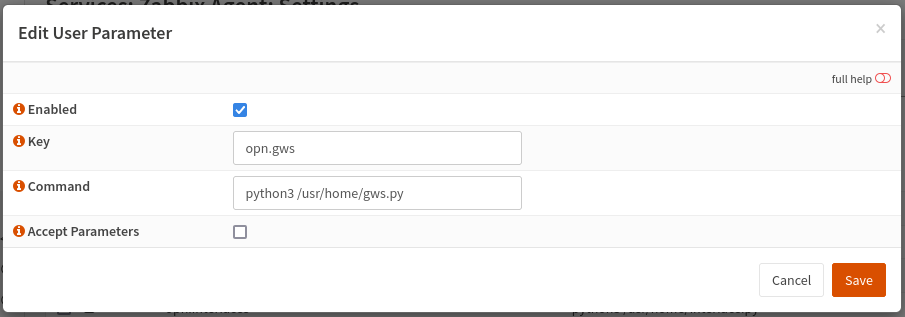
- LLD for Gateways
- Key: opn.gws
- Command: sudo python3 /usr/home/gws.py
- Single Gateway Data
- Key: opn.gw_data
- Command: sudo python3 /usr/home/gws.py $1 $2
- Accept Parameters: Checked
- LLD for Interfaces
- Key: opn.interfaces
- Command: sudo python3 /usr/home/interface.py
- Single Interface Data
- Key: opn.interface_value
- Command: sudo python3 /usr/home/interface.py $1 $2
- Accept Parameters: Checked
Apply the changes to restart the Zabbix Agent.
Zabbix Template
The final piece of the puzzle is a new template that will monitor the new values we added. You can dowload the template off GitHub here. Import that into your Zabbix instance to create the new template.
This creates a few things:
- LLD rules for the data points we noted above. It will make use of the scripts we created.
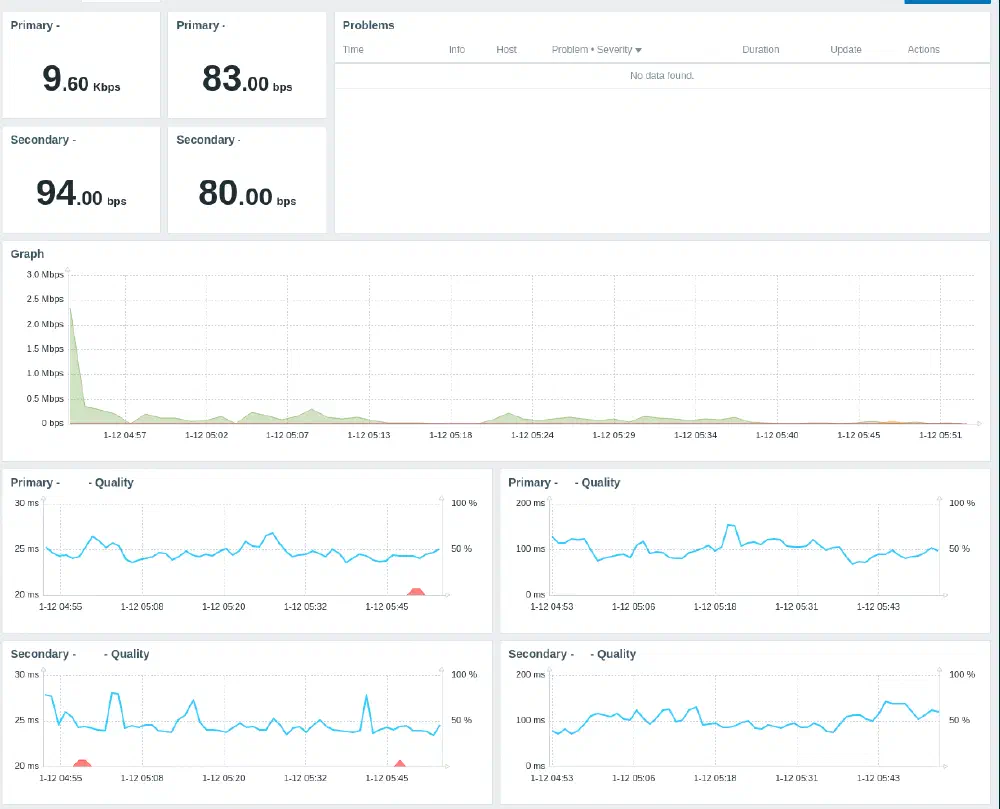
- Data points for each interface that include the CARP status, traffic in and out, and errors detected on each interface.
- Data for each gateway, including it’s status (up or down), the delay and any packet loss detected.
- Triggers for when a gateway is marked as down.
You’ll still want to use a FreeBSD template to monitor things like CPU usage and availability of the router, but feel free to disable network interface discovery in that template to prevent duplicated data.
That’s It!
Once you’ve added your router and applied that template, you should have much more useful data points for your monitoring. I added triggers for high-profile interfaces to detect if they are not the CARP leader and added most of the gateway data to a dashboard to keep track of my redundant ISP setup.
I’ll try to keep the GitHub repo updated with any changes I make as well. The scripts are not very pretty but they were a rush job to get things monitored after an outage on my end.