Last Year I showed my system and talked about how I use Trunk Recorder to monitor P25 radios. The second phase of that is monitoring the system, and thanks to the prometheus metrics Trunk Recorder exports, we can use tools like Zabbix to get data about the messages we’re seeing.
Metrics We Care About
There’s a few fairly important metrics we want to look at to monitor the health of our SDR and RF chain, and a lot of good to know but less important metrics.
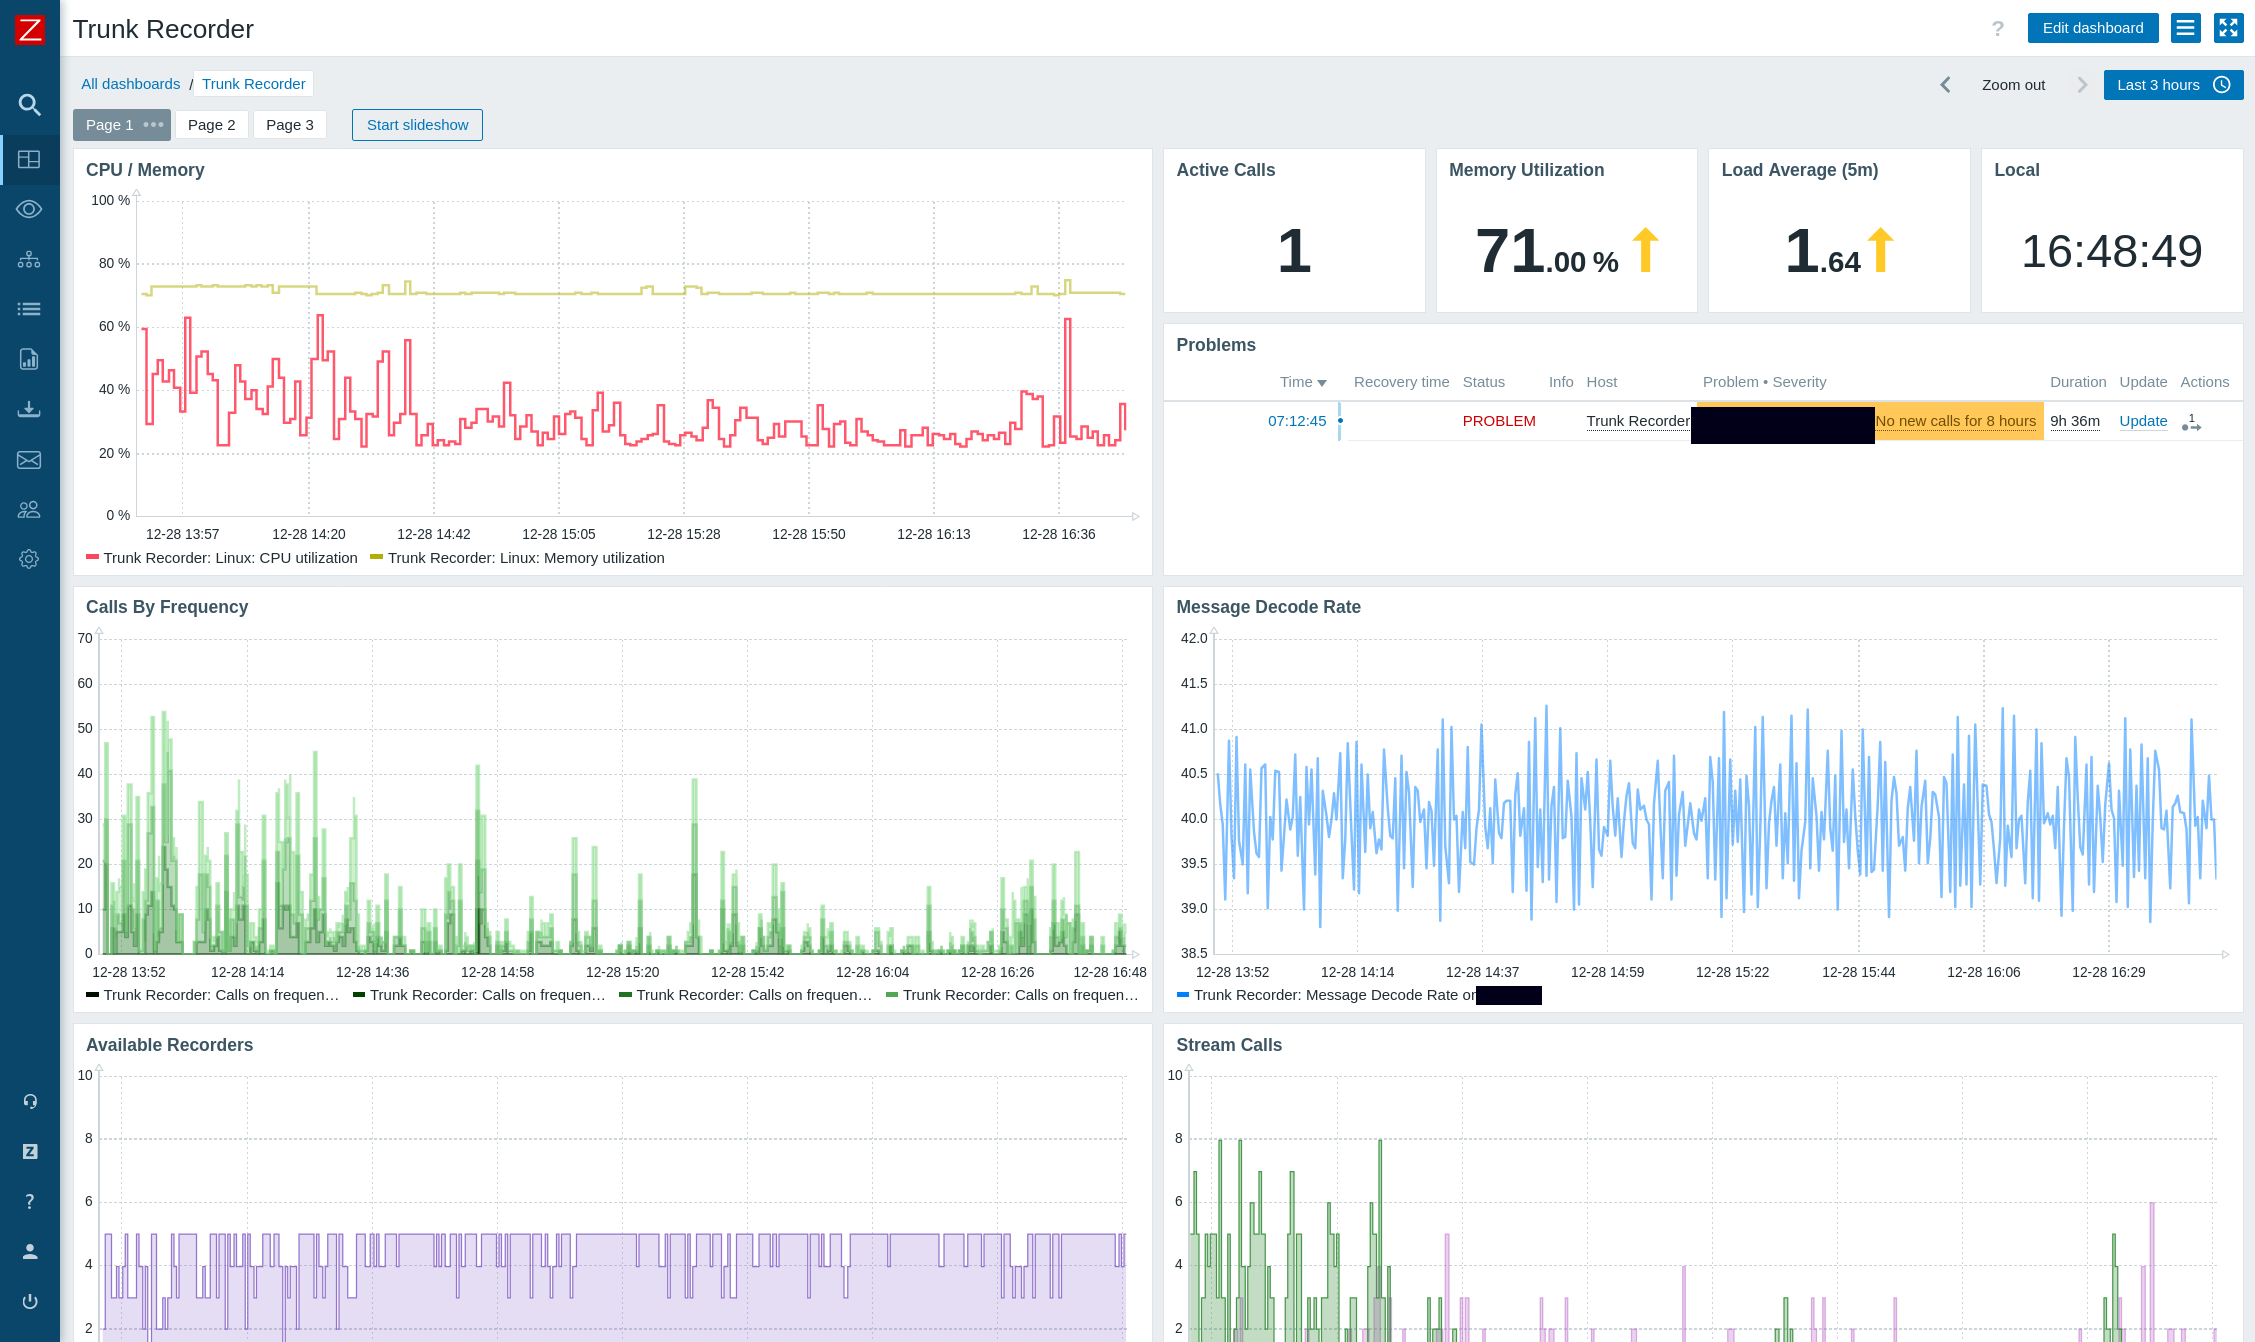
The first important one is the message decode rate. This is the rate of control channel messages that are seen, and in theory should be close to 40 messages per second. If your RF chain is having reception issues, this rate will drop and you’ll start to hear choppy audio or missed transmissions.
Another is the count of available recorders. Should the number of recorders we set up be too low, the system gets very busy, or there’s some other hardware or RF issue this will drop to 0. When it’s 0, no new recordings are being made.
Finally, I pay close attention to the call rate on our Liquid Soap streams. These talkgroups should always be somewhat active, and if we start to see long gaps without any new transmissions that may be a change in the P25 system we need to account for, our RF chain going bad, or an internal issue with the scripts that send data into Liquid Soap.
Some other metrics of less value but still nice to know:
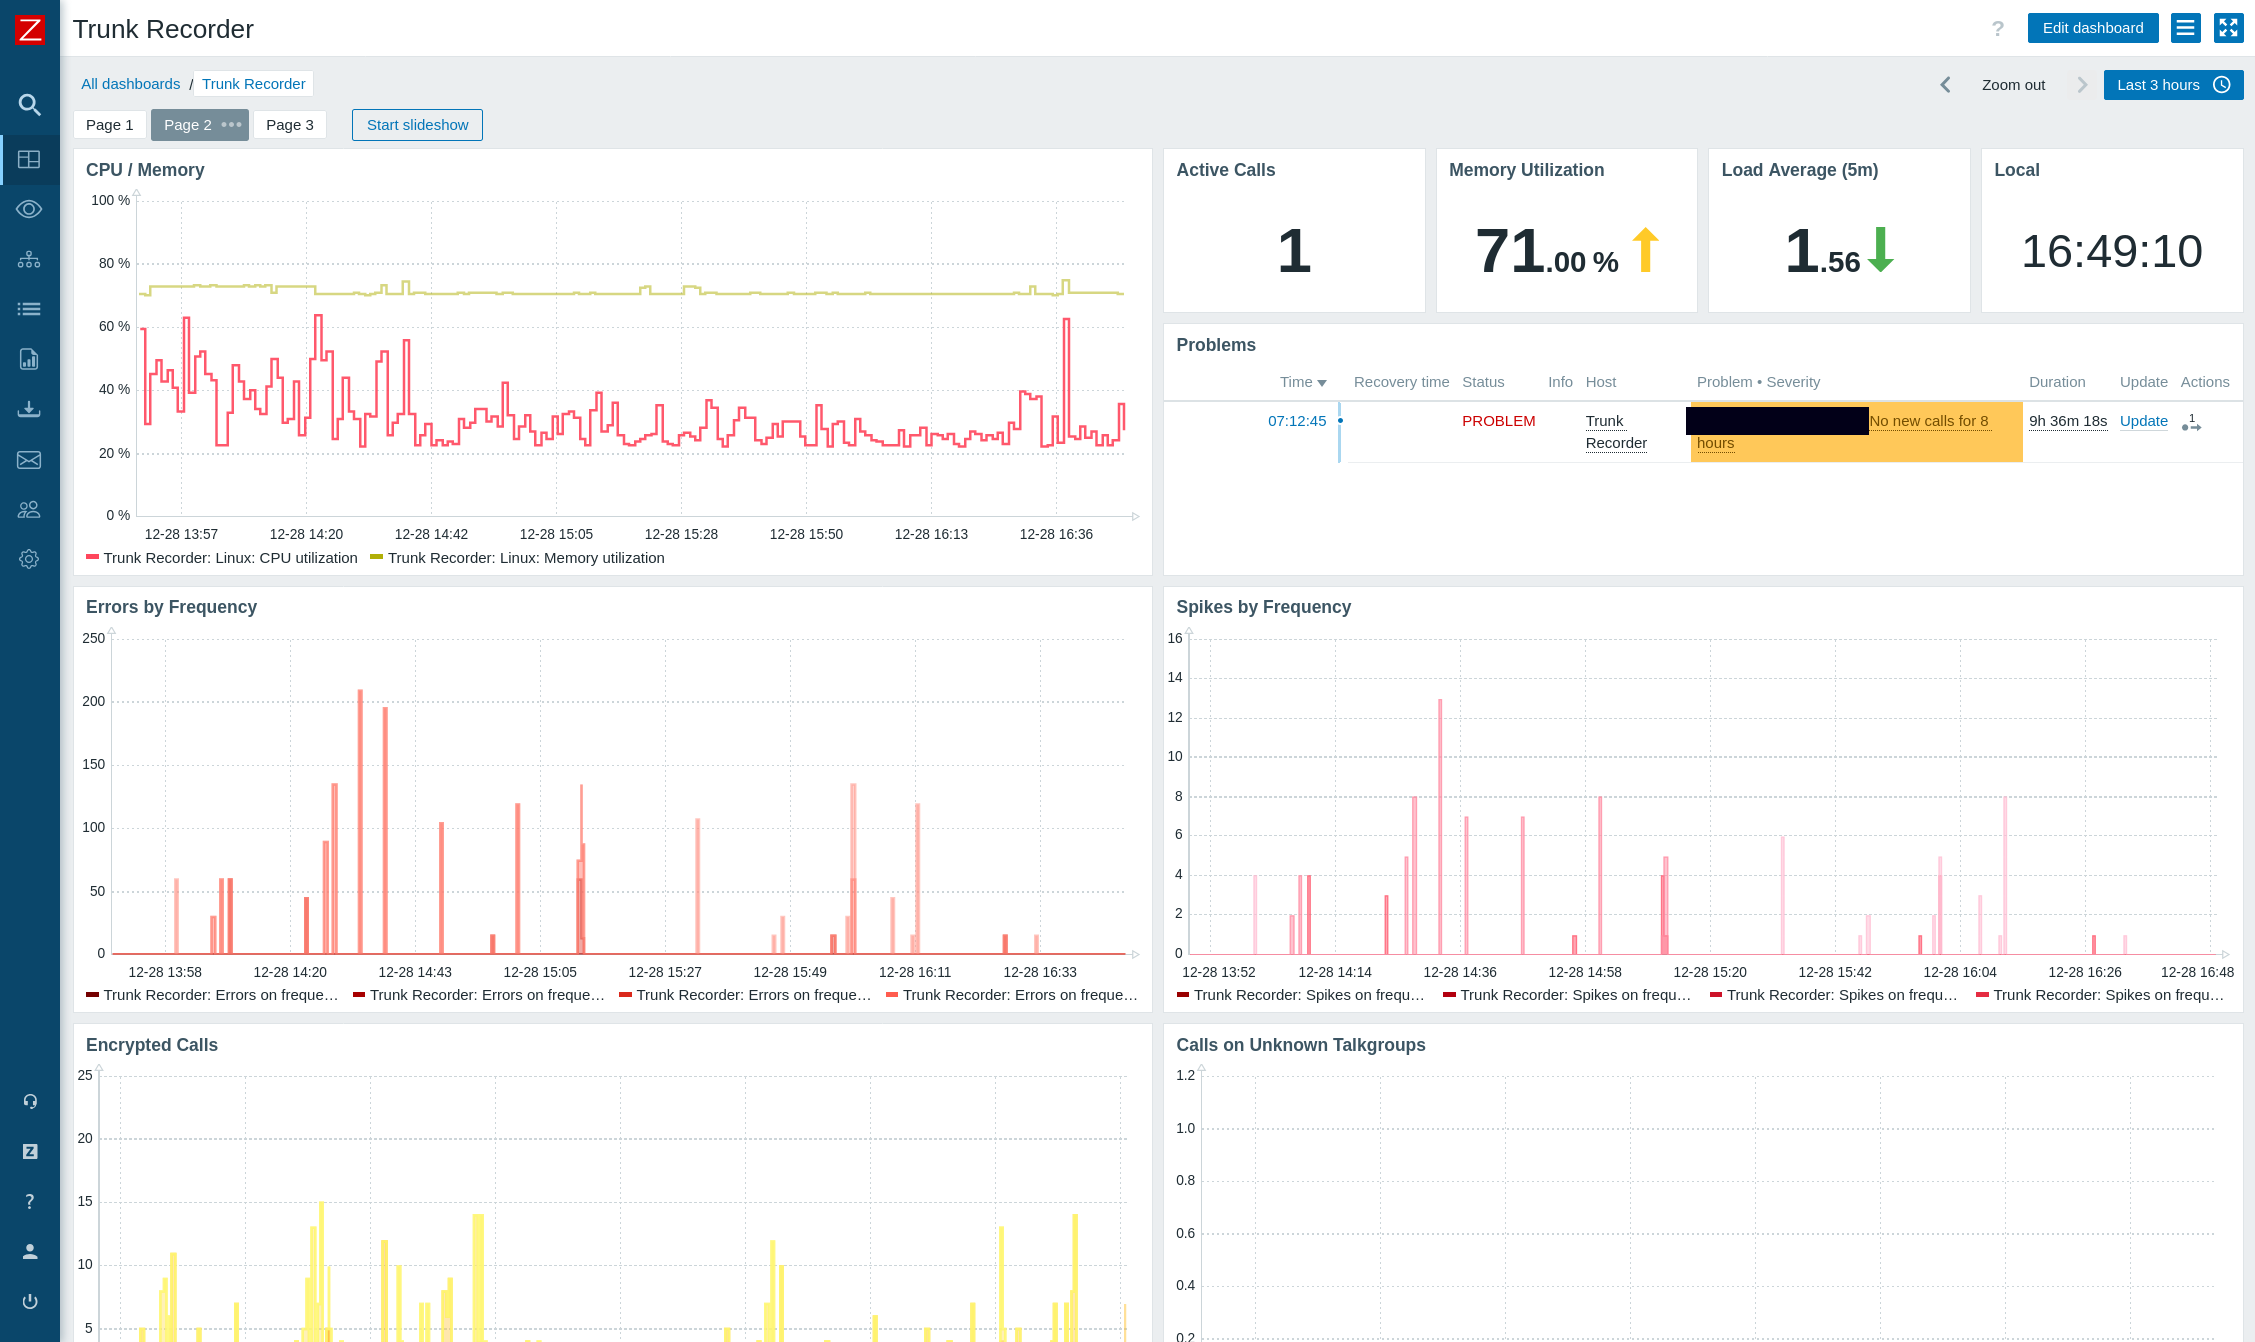
- Errors and Spikes - These are the number of receive errors and consecutive receive errors. These sound important, but the P25 system will parrot errors and spikes that come in from a radio on the network. For example, if a radio is just barley in range the controller may get a number of errors and garbled audio. It will broadcast that back out (because something is better than nothing), but it doesn’t mean there’s any issues with our system’s receiver.
- Call rate - This is nice to see, but it’s too verbose on larger systems to be of use. I collect and graph it on the dashboard in Zabbix, but there’s less value.
- Encrypted Calls - Transmissions that are marked as encrypted are worth keeping track of, but there’s nothing we can do to listen to these. Encryption is becoming more common, so a sudden spike here might mean a talkgroup or two got moved to be fully encrypted.
- Unkown Talkgroups - These are calls that came in but weren’t in a talkgroup in the CSV file given to trunk recorder. If you see a lot of these, you might have new talk groups to identify.
Zabbix Templates
The rest of my monitoring is in Zabbix, so I’m using it here. We make use of a few discovery rules for most of the Trunk Recorder things, as data can by dynamic if you add more SDRs or P25 systems. I’ve added the values to a template that you can import and attach to the node.
To use the template, just apply it to your Trunk Recorder node that is running a Zabbix agent. Some checks will use HTTP checks, but the same IP address will be used for both the Zabbix agent and any HTTP requests.
How This Template Works
This template is using the Prometheus format metrics that are coming from the Trunk Recorder program, as well as a few other files we add metrics data to in the Liquid Soap streams.
Prometheus exports data via a simple HTTP request that returns a formatted list of data, and Zabbix can parse the rows out to give us more detailed metrics. For Trunk Recorder, these are at http://ip-of-your-system:9842/metrics. Trunk Recorder gives fairly verbose information here, snd breaks down a lot of metrics by frequency, SDR, or talkgroup where it makes sense.
We use LLD rules to get the list of things like frequencies, talkgroups, etc and build metrics off of that. This should allow us to add new recorders, or changes in the system such as new frequencies or talkgroups to be handled by our monitoring without us needing to intervene.
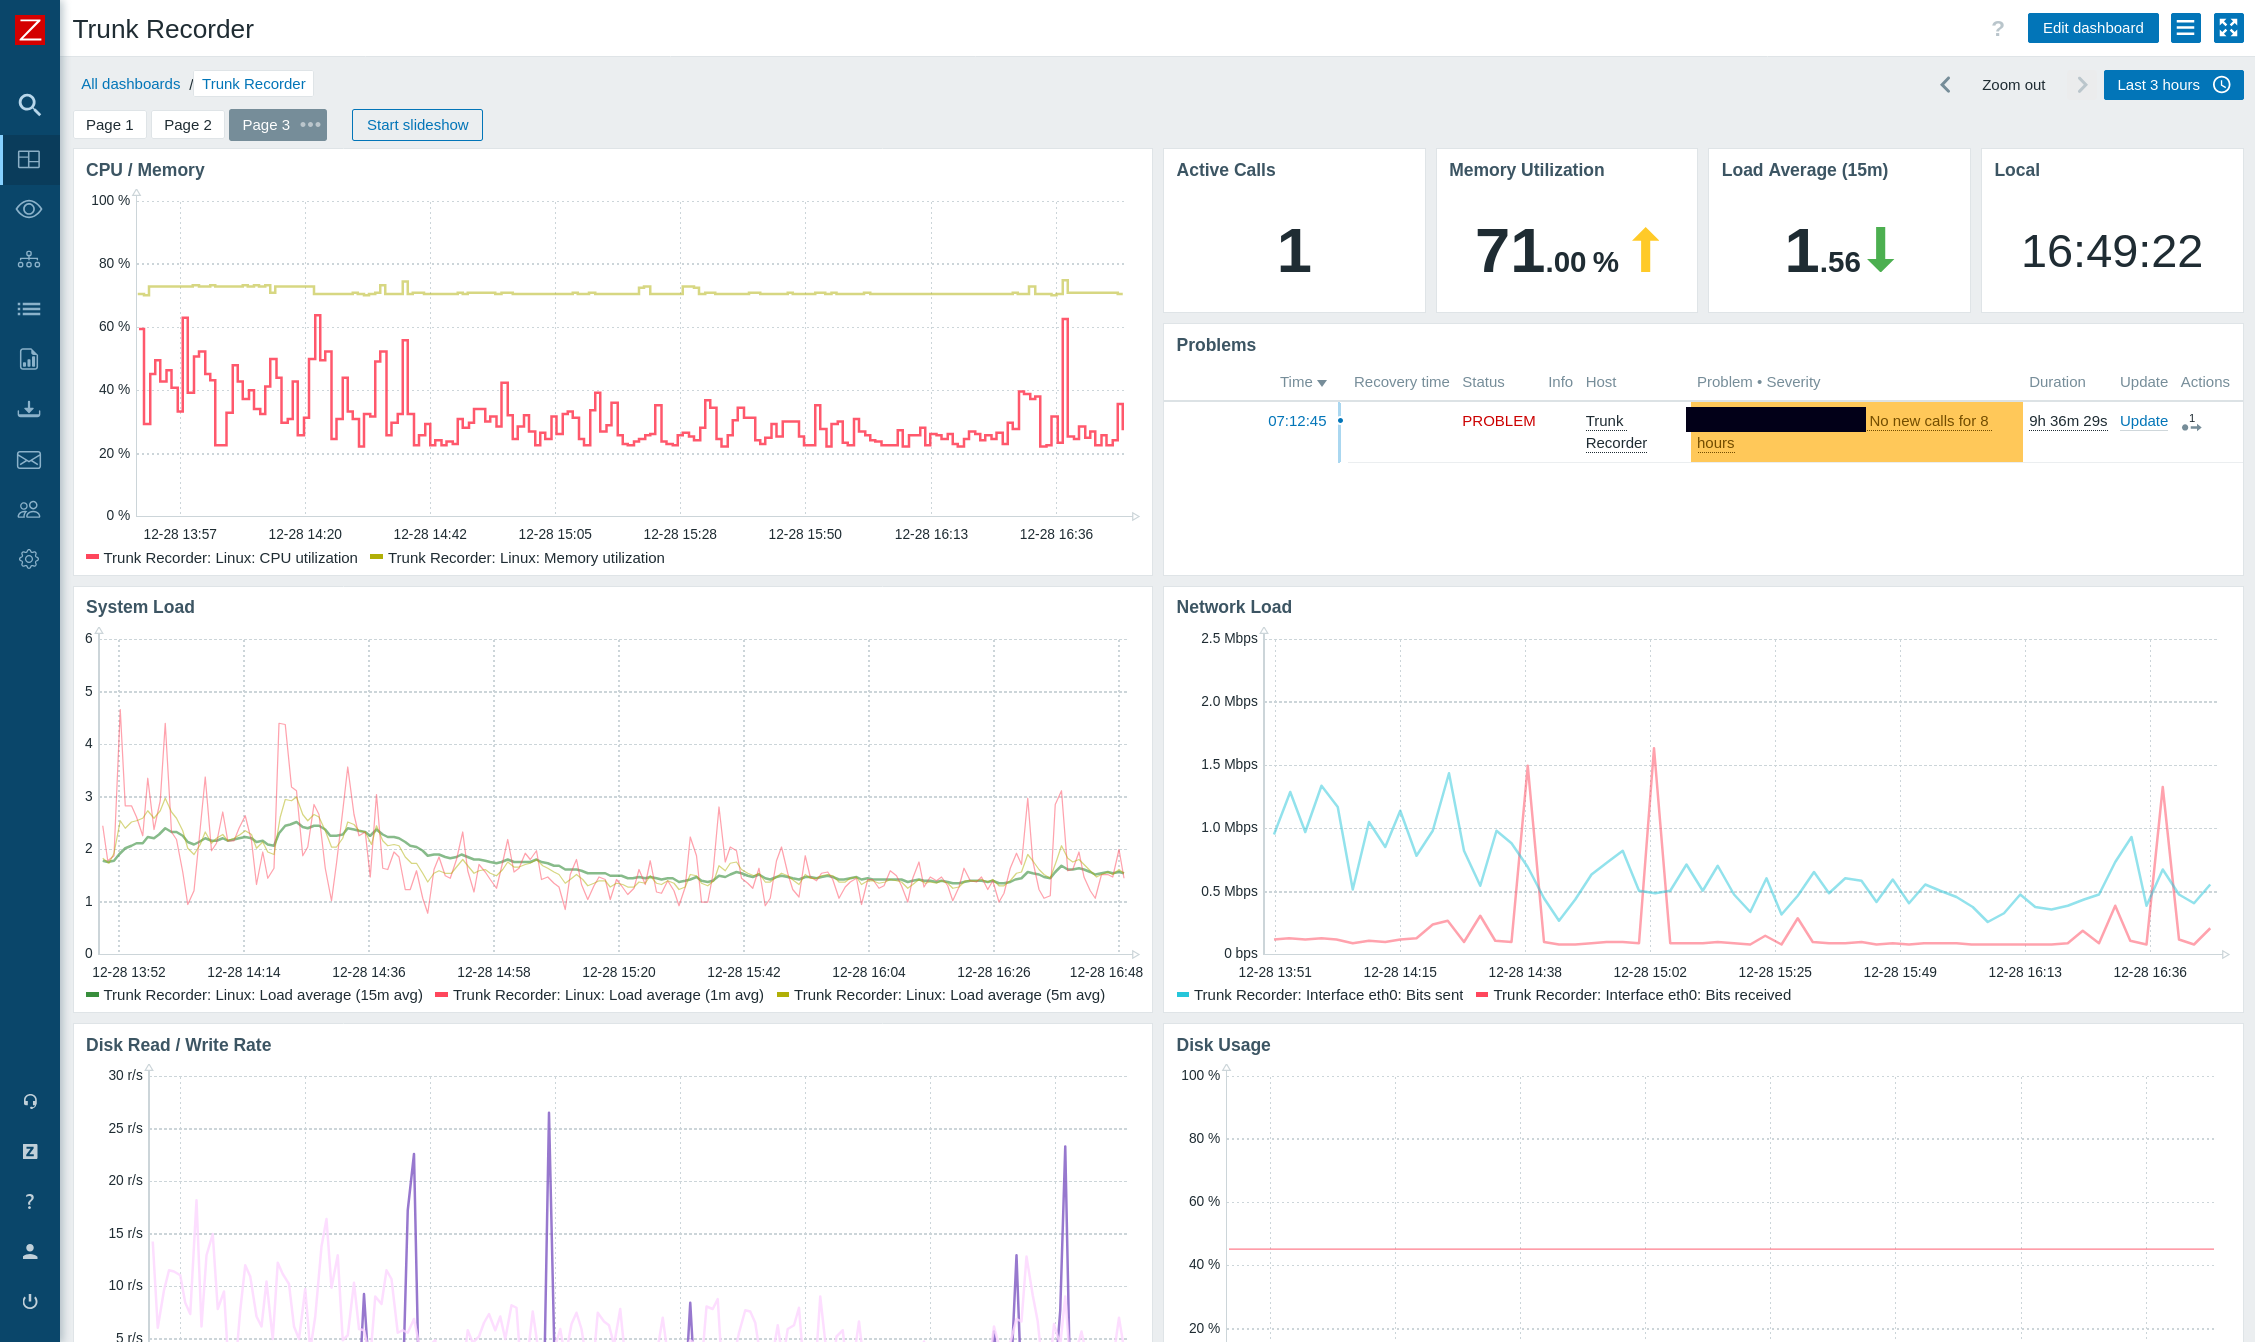
Dashboards
There isn’t a way (at least that I know of) to export, but creating dashboards is easy enough in Zabbix. Here are the dashboard screens I’ve created for my system: