A few months back, I set up an ADS-B plane tracker to watch airplanes that were in the area. So far that has seen a few really neat things, including aerobatic competitions and a few emergency landings. In my quest to be even nosier, I wanted to also listen in on the local P25 radio system, and used the hardware design from before to accomplish this.
The software, though, is a bit more complicated. Probably needlessly so, but I’ll use this guide to walk through how I listen to the local P25 system.
This guide is long, I’m sorry in advance. There’s a Table of Contents to help.
P25 Radios
I won’t get into how P25 radios work, we’d be here all day and most of the night. Looking it up and having at least a basic level of knowledge is helpful, but I’ll leave that up to you (there’s tons of guides, articles, videos, etc).
Before proceeding, you’ll need the following:
- The list of frequencies for the system(s) you want to listen to. You can find these on Radio Reference usually.
- A list of talk groups you want to listen to. The system will record traffic
from unknown talk groups, but it’s easier to start with some list. I made a
spreadsheet with these columns:
- Decimal ID and Hex ID (use DEC2HEX)
- Alpha Tag - This is the short name that you’d see on a space constrained radio screen.
- Description - The name the will most often be displayed.
- Group - What kind of talkgroup is this. You can organize them however you like.
- Priority - This is used to skip talk groups that may be noisy and exhaust your recorders. You’ll set a fix number of recorders, and if at least Priority - 1 recorders are free, it’ll record the transmission. For example, if you set it to 1 (the default), 0 recorders need to be free. 2 needs 1 free recorder, etc.
One thing I’ll mention, though, since it’s not super clear is how talkgroups work on large networked systems. I designate a talkgroup as “local” or “remote”. All talkgroups will work on your system and you’ll hear any in the area, but only local talkgroups are normally broadcast. Should a radio (not your scanner as the radio has to handshake with the controller) tune a remote talk group, it’ll show up and your scanner will hear it.
If you’re looking at a large system, it’s a bit of trick to identify what traffic is in the area, as your system might seep into other areas. You can go back and add talkgroups later, and your system will still record the calls, so don’t stress too much and don’t feel like you need to sort 5000 or more talkgroups.
Selecting Hardware
For my project, the base hardware is the exact same as the ADS-B tracker, except with a different SDR.
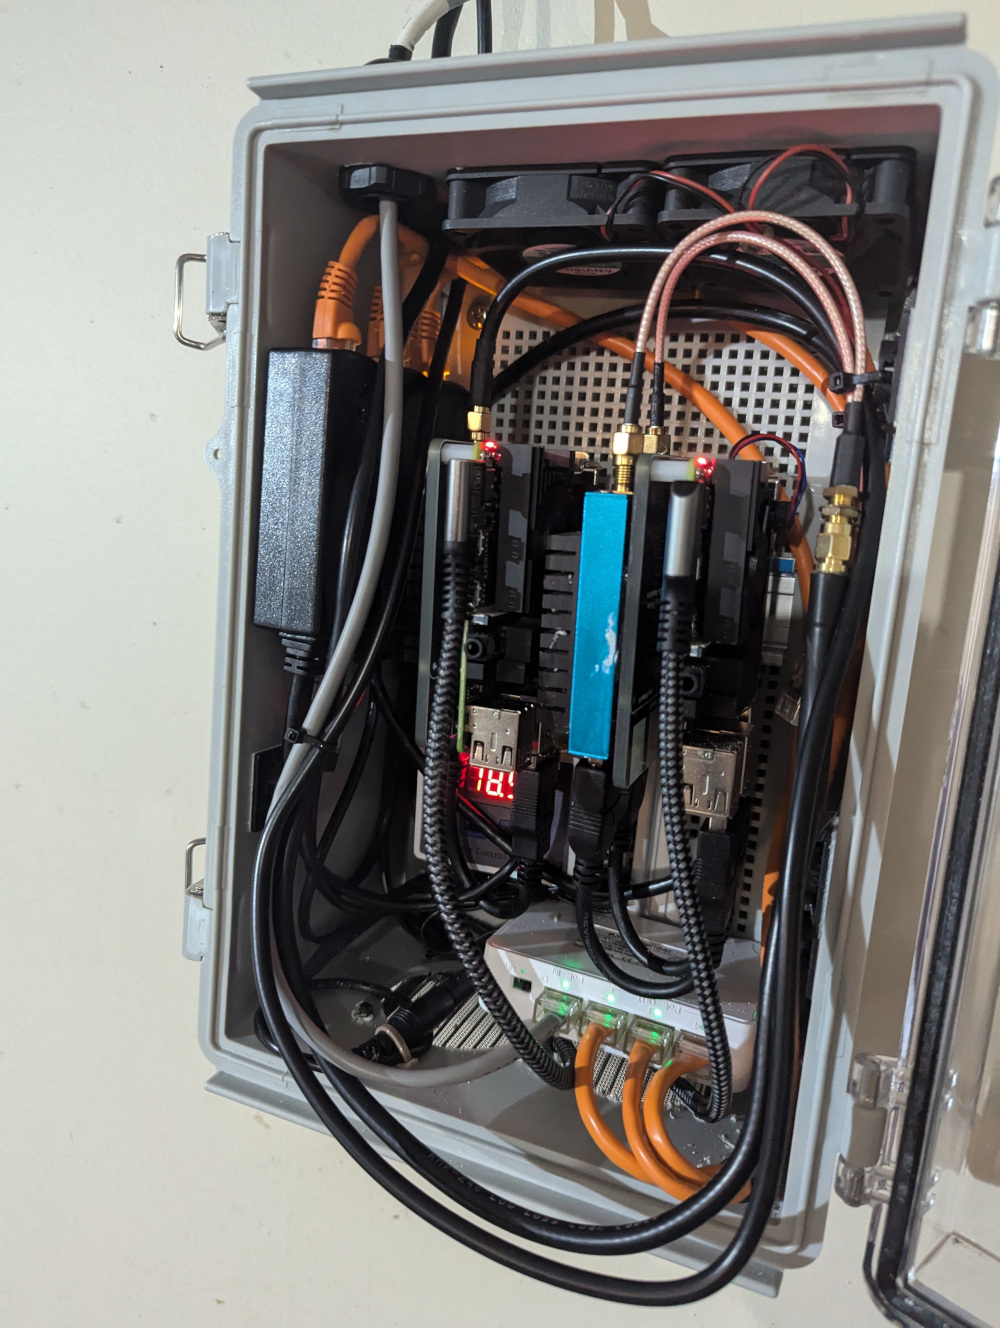
(That’s it on the left)
There are a few ways to “listen” to trunked systems, each with their advantages and disadvantages. This dictates our hardware design and selection a bit.
The first is to use an SDR like a conventional scanner. It watches just the control channel for a message you’re interested, then tunes to the frequency of the transmission, then back. This lets you use fewer SDRs, as you can start with just one or two, but can limit your concurrency, as you’re now limited by the number of SDRs you can chain together.
The other way, and the way the software we’ll talk about uses, is to sample as much as the SDR can, then pick out data on each frequency. This lets you potentially capture all the transmissions with fewer SDRs, but it requires more planning when setting things up.
In my case, these are the frequencies used by my P25 system (c indicates a control channel):
854.9875 857.4375c 858.2125c 858.4375 858.9375 859.4875
The difference between the max an min frequency is 4.5MHz, so we’d to sample that much RF spectrum to get all the transmissions. SDRs like the RTL-SDRs can sample up to 2.4MHz at once, so we’d need at least 2. To make the antenna simpler, though, I opted to use a single AirSpy Mini that can sample 6MHz of spectrum at once. With one SDR, I can see any potential frequency in use without having to retune the SDR.
Trunk Recorder wants each SDR to be tuned to a center frequency, then it’ll use it to watch frequencies above and below. The advantage here is that with one SDR I can have 8+ transmissions recorded at once, but if you have a complex system or want to use RTL-SDRs that have a narrower frequency range, you’ll need more and need more planning.
I’m skipping a lot of details, but they will vary widely depending on your system, the SDR you want to run, and more. If this is all as clear as mud, check out the docs for Trunk Recorder, as it has a good walkthrough that can help the discovery phase of your project.
Software
The software has a number of moving parts, and each have their own role and way of getting data.
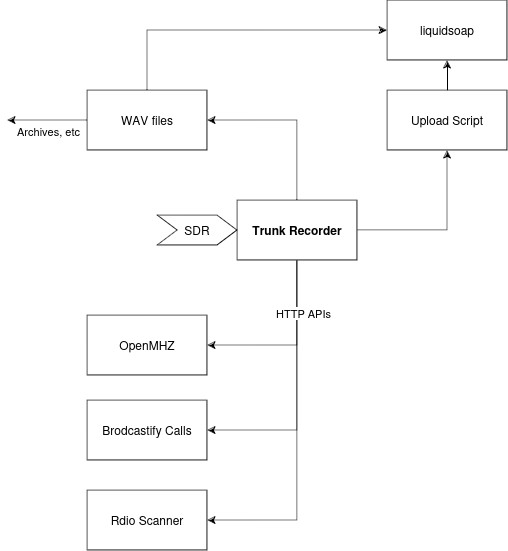
The heart of the system we’ll build is using Trunk Recorder. This program takes data from your SDR and decodes the transmissions to create wav files on your hard drive. Trunk Recorder on its own, though, isn’t super useful. To listen to recordings, we’ll need some front end. We configure 4 different ones here:
- Open MHz is a public site that allows us to upload and archive the recordings coming from our system. It accepts recordings via an HTTP API that’s built into Trunk Recorder.
- Broadcastify has a similar service called Broadcastify Calls. It also is uploaded directly from Trunk Recorder.
- For local listening, we’ll use Rdio Scanner. This accepts the recordings via an HTTP API as well.
- We also send data to Broadcastify Streams. These are the classic plain audio streams that have been around for a long time, but these require some work to get set up. This requires a script to sort and send the information to a stream process, then that process reads the file and plays it.
To get all these running at the same time, though, is … tedious.
I should point out that there are at least a few prebuilt Raspberry Pi images that do all of this for you. I haven’t used them, I don’t know how well they work, but they’re probably easier if you’ve never dealt with Linux systems before. Broadcastify makes one such image.
Setup Overview
Since there are so many moving parts, I use Puppet to deploy the changes. This forced me to keep some of the docker components a bit more independent, but that’s not a bad thing. Throughout the configuration, I’ve called out config sections you can leave out if you’re not setting up each part.
Before starting, make sure that your SDR has the needed drivers and is working. Use a tool such as gqrx to check things are alive.
I made a directory, /opt/trunk-recorder, that houses nearly everything. I
also made these directories:
recorder- Trunk Recorder’s root directoryscanner- Rdio Scanner’s root directory.recordings- Where recorded audio files and metadata are stored.streams- Where we’ll configure liquidsoap.
We also include Prometheus type metrics that we can use to collect stats in our monitoring platform of choice. We’ll talk more about metrics in Part 2, but for now we’ll enable them.
Trunk Recorder
Trunk Recorder has a nice prebuilt Docker image, but we’ll need to modify it. We need to install more software for some of the streams, but we also configure Prometheus metrics to watch how the system is performing.
In /opt/trunk-recorder, create a docker-compose.yaml file:
services:
  recorder:
    build: recorder/.
    container_name: trunk-recorder
    restart: always
    privileged: true
    devices:
      - "/dev/bus/usb:/dev/bus/usb:rwm"
    volumes:
      - /var/run/dbus:/var/run/dbus
      - /var/run/avahi-daemon/socket:/var/run/avahi-daemon/socket
      - ./recorder:/app
      - ./recordings:/recordings
      - ./streams:/streams # Omit if you're not using liquidsoap
      - './run:/var/run/liquidsoap' # Omit if you're not using liquidsoap
    ports:
      - 9842:9842

  # Omit if you're not using rdio scanner
  scanner:
    image: chuot/rdio-scanner
    container_name: rdio-scanner
    restart: always
    ports:
     - 3000:3000
    volumes:
      - ./scanner:/app/data
To run the Prometheus exporter, we’ll need to build the module. In
/opt/trunk-recorder, clone the required repo:
git clone https://github.com/USA-RedDragon/trunk-recorder-prometheus.git recorder
This should create a Dockerfile that has the build steps in it, but we’ll also
modify this to add even more build steps. Replace it with this file:
FROM ubuntu:22.04@sha256:58b87898e82351c6cf9cf5b9f3c20257bb9e2dcf33af051e12ce532d7f94e3fe as prometheus-cpp-builder

RUN apt update && export DEBIAN_FRONTEND=noninteractive && \
    apt install -y curl git cmake build-essential file zlib1g-dev && rm -rf /var/lib/apt/lists/*

# renovate: datasource=github-tags depName=jupp0r/prometheus-cpp
ARG PROMETHEUS_CPP_VERSION=v1.2.4

RUN git clone https://github.com/jupp0r/prometheus-cpp -b ${PROMETHEUS_CPP_VERSION} /tmp/prometheus-cpp && \
    cd /tmp/prometheus-cpp && \
    git submodule init && \
    git submodule update && \
    mkdir build && \
    cd build && \
    cmake -DCPACK_GENERATOR=DEB -DBUILD_SHARED_LIBS=ON -DENABLE_PUSH=OFF -DENABLE_COMPRESSION=ON .. && \
    cmake --build . --target package --parallel $(nproc) && \
    mv prometheus-cpp_*.deb /prometheus-cpp.deb && \
    cd - && \
    rm -rf /tmp/prometheus-cpp

FROM ghcr.io/robotastic/trunk-recorder:edge@sha256:a104309dd07ffb2c6cfcf13da4fc634eb35278749b34a2a55d67f3507a581ab9

COPY --from=prometheus-cpp-builder /prometheus-cpp.deb /tmp/prometheus-cpp.deb
RUN apt update && export DEBIAN_FRONTEND=noninteractive && \
    apt install -y /tmp/prometheus-cpp.deb && \
    rm -rf /var/lib/apt/lists/*

WORKDIR /src/trunk-recorder-prometheus

COPY . .

WORKDIR /src/trunk-recorder-prometheus/build

RUN mv /etc/gnuradio/conf.d/gnuradio-runtime.conf /tmp/gnuradio-runtime.conf && \
    export DEBIAN_FRONTEND=noninteractive && \
    apt-get update && \
    apt-get install --no-install-recommends --no-install-suggests -y \
        git \
        cmake \
        make \
        libssl-dev \
        build-essential \
        gnuradio-dev \
        libuhd-dev \
        libcurl4-openssl-dev \
        libsndfile1-dev && \
    cmake .. && make install && \
    apt-get purge -y git cmake make libssl-dev build-essential gnuradio-dev libuhd-dev libcurl4-openssl-dev libsndfile1-dev && \
    mv /tmp/gnuradio-runtime.conf /etc/gnuradio/conf.d/gnuradio-runtime.conf && \
    rm -rf /var/lib/apt/lists/*

RUN rm -rf /src/trunk-recorder-prometheus

### Omit this section if you aren't using broadcastify calls
# Build steps for fdk-aac
RUN apt update && export DEBIAN_FRONTEND=noninteractive && \
    apt install -y curl git cmake build-essential autoconf automake autotools-dev libtool

RUN git clone https://github.com/mstorsjo/fdk-aac /tmp/fdk-aac && \
       cd /tmp/fdk-aac && \
       autoreconf -fiv && \
       ./configure --enable-shared && \
       make -j4 && \
       make install && ldconfig

# Deps for broadcastify calls
RUN apt update && export DEBIAN_FRONTEND=noninteractive && \
       apt install -y libssl-dev libcurl4-openssl-dev fdkaac sox ntp ntpstat
### END OMIT

### Omit this section if you aren't using liquidsoap
# Deps for our upload script
RUN apt update && export DEBIAN_FRONTEND=noninteractive && \
       apt install -y python3-minimal
### END OMIT

WORKDIR /app
Some of the software we need isn’t available on arm64 from the upstream debian
repos, so we have to build it ourselves. Keep in mind, this will take several
minutes and if you build the containers as part of their start, for example,
you’ll be sitting for a while.
As a quick test, in /opt/trunk-recorder, run docker compose up --build to
test that the docker side of things work. It will take some time, but you
should get containers that start and yell about missing configuration.
To configure Trunk Recorder, start with a basic config.json file in the
/opt/trunk-recorder/recorder directory:
{
    "ver": 2,
    "captureDir": "/recordings",
    "debugRecorder": false,
    "sources": [
        {
            ...
        }
    ],
    "systems": [
        {
            ...
        }
    ],
    "plugins": [
        {
            "name": "prometheus",
            "library": "libprometheus_plugin.so",
            "port": 9842
        }
    ]
}
The config for sources and systems will vary depending on your SDR and
system, so refer to the docs for more information. We’re also omitting some
things for clarity that we’ll revisit.
You’ll also need to upload your Spreadsheet as a CSV to the
/opt/trunk-recorder/recorder directory, remove the Group column, and
configure it in the specific system.
If you restart things, you should now have a working Trunk Recorder instance. If there’s traffic you should see it start to decode things, make files, and log things in stdout.
Rdio Scanner
The next piece is Rdio Scanner, which will let us listen to things locally.
There’s no config file here, once the container starts navigate to
http://ip-of-your-server:3000/admin and login with the password rdio-scanner.
We’ll need to add our system and talkgroups, but we can import most of what we
need.
Take your spreadsheet, and export it as a CSV. Also duplicate the Group column and make a new Tag column (these can be different, but I chose to make them the same). Then in the admin interface, navigate to Tools > Import Talkgroups. Upload your CSV, check the data, and import it.
If you refresh the page, you’ll now have a new entry under Config > Systems (and Config > Tags and Config > Groups, but we won’t adjust those). Expand the system that was just created, and set up a few fields:
- ID - Set any number you like, I did 1.
- Label - The name of the system that will be displayed.
Save things and then navigate to Config > APIKey. Generate a new API key and make note of it. Trunk Recorder will use an API to notify Rdio Scanner when a new transmission comes in, and this API key is how it authenticates itself.
In the config.json file for Trunk Recorder, we can now add a new plugin (the
entire plugin block is listed for context):
"plugins": [
      {
          "name": "rdioscanner_uploader",
          "library": "librdioscanner_uploader.so",
          "server": "<http(s) URL of your Rdio Scanner install>",
          "systems": [
              {
                "shortName": "<name of your system from the `systems` section>",
                "apiKey": "<apikey you generated>",
                "systemId": <id you set>
              }
          ]
      },
      {
          "name": "prometheus",
          "library": "libprometheus_plugin.so",
          "port": 9842
      }
  ]
When you restart Trunk Recorder, you should see two things now:
- Trunk recorder will output
Rdio Scanner Upload success - Rdio Scanner will output a line with the filename and
success
And if you load the Rdio Scanner interface, you’ll hear calls if you have the talkgroup selected or see them in the Search Call button. You should also see all your talkgroups under the “Select TG” button.
Open MHz
Open MHz is a public site where you can also upload your calls. If you want to share here, navigate to https://admin.openmhz.com and create an account. You can then add a system, and complete the various fields:
- System Short Name - Take note of what you set here, as your system in
config.jsonwill need to match. - Name, Description, Location are all self-explanatory.
Once you’ve created it, you should have more tabs. We’re interested in the
Talkgroups tab, as we’ll need to upload our talkgroups here too. Upload your
spreashseet as a CSV (uploading multiple times overwrites all the data each
time). You can also configure Groups, which will allow users to pick
preselected lists of talkgroups.
Once done, head over to the Config tab, and make note of the example JSON
config. You’ll need to add that to your config.json and restart Trunk Recorder
If all is well, you’ll now also see OpenMHz upload success after each call
completes. After some time, you’ll also see the system on OpenMHz and can
listen there.
Brodcastify Calls
Another commercial service, also easy to set up. First, you’ll need to apply on their website. This can take a day or two to return, but you’ll then have the keys needed to upload your calls.
Once approved, There are three keys to add to config.json. Add
broadcastifyApiKey and broadcastifySystemId under the system, then
broadcastifyCallsServer as a top level element.
Again, restart trunk recorder and you’ll see either Broadcastify upload skipped or Broadcastify upload success. If another user is listening to the
same talkgroup and uploads their call first, yours will get skipped. This is
normal and is just de-duplication taking place.
More information is on this wiki page. If you follow that guide, keep in mind we’ve installed the needed software already.
Broadcastify Stream
The last, the lowest bar to enter for non radio nerds, and the hardest to set up. This is adapted from the wiki
The issue here is Trunk Recorder is really good at making a bunch of single files, but we need to convert them into a stream we can send out and handle cases like multiple calls coming in at the same time.
To do this, we’ll make use of a tool called Liquid Soap. The workflow looks like this.
- Call comes in and is decoded by Trunk Recorder. It writes a few files with audio and metadata.
- Trunk Recorder calls a script we add, this script sorts it based on talk group into a stream.
- The script sends a filename over a socket to Liquidsoap, which then begins to play the file.
- This output is directed at Broadcastify who then streams it on their site.
I also wanted things to be separate from my main docker setup so I can restart things faster for minor updates here.
First, we create a file that contains most of the basic config shared between
all streams. In /opt/trunk-recorder/streams/stream.inc, add:
# ok in docker and necessary as TR runs as root too
settings.init.allow_root.set(true)

# Configure Logging
log.stdout.set(true)

# create a socket to send commands to this instance of liquidsoap
settings.server.socket.set(true)
settings.server.socket.path.set("<sysrundir>/#{STREAMID}.sock")

# This creates a 1 second silence period generated programmatically (no disk reads)
silence = blank(duration=1.)

def append_title(meta) =
  [("title","Scanning...")]# Silence metadata
end

silence = map_metadata(append_title, silence)
# This creates a 1 second silence period generated programmatically (no disk reads)

recorder_queue = request.queue()

recorder_queue = amplify(AMPLIFY, recorder_queue)

# If there is anything in the queue, play it.  If not, play the silence defined above repeatedly:
stream = fallback(track_sensitive=false, [recorder_queue, silence])

output.icecast( %mp3(stereo=false, bitrate=16, samplerate=22050),
  host=HOST, port=80, password=PASSWORD, genre="Scanner",
  description="Scanner audio", mount=MOUNT,  name=NAME, user="source", stream)
Then for each stream, where streamname is an internal name you give it, make
these files:
streamname.tgs- The talk groups to send onto this stream.streamname.liq- Variables for the liquidsoap daemonstreamname.yaml- A docker-compose.yaml file that sets some variables.
streamname.tgs is a simple file with one talkgroup on each line:
1234
2134
6423
streamname.liq is the variables specific to that stream. All these variables
come directly from Broadcastify once your stream is approved.
#!/usr/bin/liquidsoap
HOST="xxxx"
MOUNT="xxxx"
PASSWORD="xxxx"
NAME="xxxx"
STREAMID="xxxx"
AMPLIFY=3.0 # If the stream is too quiet, increase or decrease this value
%include "stream.inc"
Then, in streamname.yaml, add:
services:
    stream_streamname:
        image: 'savonet/liquidsoap:v2.0.3'
        user: root
        command:
            - /etc/liquidsoap/streamname.liq
        restart: always
        privileged: true
        volumes:
            - '/opt/trunk-recorder/recordings:/recordings:ro'
            - '/opt/trunk-recorder/streams:/etc/liquidsoap'
            - '/opt/trunk-recorder/run/liquidsoap:/var/run/liquidsoap'
        container_name: streamname
This will start a container with liquidsoap, point it to our config file, and start streaming.
The last piece here is the glue to send the calls into the liquidsoap
containers. I wrote this python script in
/opt/trunk-recorder/recorder/stream_upload.py:
#!/usr/bin/python3

import socket
import sys
import os
import time
import json

# These are a few stats type functions so we can keep track of things in Zabbix
def report(stream, ok, fail):
    filename = '/streams/%s.stats' % stream
    if not os.path.isfile(filename):
        jsonData = {
            "ok": 0,
            "fails": 0,
        }
    else:
        with open(filename, 'r') as f:
            jsonData = json.load(f)

    if not jsonData:
        raise RuntimeError("Unable to load stats file for %s" % stream)

    if ok:
        jsonData['ok'] = jsonData['ok'] + 1
    if fail:
        jsonData['fail'] = jsonData['fail'] + 1

    with open(filename, 'w') as f:
        json.dump(jsonData, f)


filepath = sys.argv[1]
jsonpath = os.path.splitext(filepath)[0] + ".json"
#while tr v4+ does pass json path as arg, will still generate it this way for v3 compat

with open(jsonpath, 'r') as f:
  jsonData = json.load(f)
talkgroup = jsonData['talkgroup']

# Load the maps of talkgroups and steams they go to.
streams = {}
for file in os.listdir("/streams"):
    if file.endswith(".tgs"):
        streams[file.replace('.tgs', '')] = []

for stream in streams.keys():
    tgs = []
    with open("/streams/%s.tgs" % stream) as file:
        for line in file:
            if line.strip() == '':
                continue
            tgs.append(line.strip())

    streams[stream] = tgs

# Assign this call to a stream based on talkgroup
stream_outputs = []
for stream in streams.keys():
    for tg in streams[stream]:
        if int(tg) == int(talkgroup):
            stream_outputs.append(stream)
            break

if len(stream_outputs) == 0:
    print('SKIP: Transmission not tied to a streamed talkgroup')

# Create a UDS socket
sock = socket.socket(socket.AF_UNIX, socket.SOCK_STREAM)

status = []
for stream in stream_outputs:
    try:
        sock.connect("/var/run/liquidsoap/liquidsoap/%s.sock" % stream)
    except socket.error as msg:
        print('socket error: %s' % msg)
        status.append("FAIL: %s" % stream)
        report(stream, False, True)
        continue

    try:
        # Send data
        metaCommand = "annotate:title='"+jsonData['talkgroup_tag']+"':"

        message = 'request.queue_0.push {0}{1}{2}\n\r'.format(metaCommand,'',filepath)
        # print('sending "%s"' % message.strip())
        sock.sendall(message.encode())
        status.append("OK: %s" % stream)
        report(stream, True, False)

    finally:
        quit = "exit\r\n"
        sock.send(quit.encode()) #to avoid disconnect without goodbye message, though not necessary :)
        time.sleep(0.5) #to avoid disconnect without goodbye message, though not necessary :)
        sock.close()

print('  '.join(status))
This script does a few things:
- Builds a list of streams and talkgroups by looking at all the
streamname.tgsfiles. - Sends the file to each stream (multiple streams are supported).
- Writes a log line for each stream.
- Record stats for each stream.
We need to tell Trunk Recorder about it, so add this to they system object:
"uploadScript": "/app/stream_upload.py"
Then, again, restart Trunk Recorder. You should see it call the script after each call, and the script skip all recordings if you don’t have any configured.
I then added a Systemd unit to manage all these processes. This is the unit file:
[Unit]
Description=Scanner Stream (%i)
Requires=docker.service
After=docker.service

[Service]
RemainAfterExit=true
WorkingDirectory=/opt/trunk-recorder/streams

StartLimitInterval=5
StartLimitBurst=10
TimeoutStartSec=600

ExecStartPre=/usr/bin/docker compose -f %i.yaml pull
ExecStart=/usr/bin/docker compose -f %i.yaml up
ExecStop=/usr/bin/docker compose -f %i.yaml down -v

Restart=always
RestartSec=30

[Install]
WantedBy=multi-user.target
Software Wrap Up
Here’s my config.json as an example:
{
    "ver": 2,
    "captureDir": "/recordings",
    "debugRecorder": false,
    "sources": [
        {
            "driver": "osmosdr",
            "device": "---",
            "center": 857234375,
            "rate": 6000000,
            "ifGain": 10,
            "mixGain": 7,
            "lnaGain": 7,
            "digitalRecorders": 8
        }
    ],
    "systems": [
        {
            "shortName": "---",
            "apiKey": "---",
            "control_channels": [
                12345,
                12345
            ],
            "type": "p25",
            "talkgroupsFile": "ksics.csv",
            "squelch": -80,
            "modulation": "qpsk",
            "broadcastifyApiKey": "---",
            "broadcastifySystemId": ---,
            "uploadScript": "/app/stream_upload.py"
        }
    ],
    "uploadServer": "https://api.openmhz.com",
    "broadcastifyCallsServer": "https://api.broadcastify.com/call-upload",
    "plugins": [
        {
            "name": "rdioscanner_uploader",
            "library": "librdioscanner_uploader.so",
            "server": "---",
            "systems": [
                {
                  "shortName": "---",
                  "apiKey": "---",
                  "systemId": 1
                }
            ]
        },
        {
            "name": "prometheus",
            "library": "libprometheus_plugin.so",
            "port": 9842
        }
    ]
}
In part 2, we’ll look at how to monitor metrics for this system, which is another can of worms but super useful.